A debugger that feels like it was always there — e 0.6.7
e 0.6.7 ships a real step debugger — breakpoints, a live call stack, and inspectable variables — built to feel like it was always part of the editor.
There's a certain lie we all tell ourselves as PHP developers. We say we don't need a step debugger. We have dd(). We have ray(). We have that one friend, var_dump(), who has never let us down (except for all the times it has). We sprinkle these little breadcrumbs through our code, refresh the page, squint at the output, delete the breadcrumbs, and repeat — a ritual so familiar it stops feeling like friction and starts feeling like work.
But every so often you hit a bug that dd() just can't hold. A value that's correct on line 40 and wrong on line 80, with a dozen branches in between. A collection that's mutated three closures deep. That moment when you'd give anything to just… stop time, look around, and poke at things.
That's what shipped in e 0.6.7. A real step debugger — breakpoints, a live call stack, variables you can actually inspect — and, true to the spirit of e, it tries hard to feel like it was always part of the editor.
Why we built it
For a long time, step-debugging was the last big card PhpStorm held. You can love a fast, native editor and still keep a heavyweight IDE around "just for debugging." We didn't want that asterisk next to e anymore. If e is going to be the editor for the rest of us, then setting a breakpoint and pressing a key should be as ordinary as saving a file.
The trick was doing it the e way: no bloat, nothing to babysit, and — crucially — nothing you have to install just to keep working normally. If you never open the debugger, you should never know it's there.
How it works, in one breath
Under the hood there's a new little crate, e-dap, a sibling to our existing e-lsp. Where e-lsp speaks the Language Server Protocol, e-dap speaks the Debug Adapter Protocol — the same protocol VS Code uses. That one decision is why this feature punches above its weight: PHP came first, but JavaScript and Rust came along nearly for free.
For PHP, the chain looks like this:
F5 in e → e-dap → php-debug adapter → Xdebug → your app
And the runtime half — loading Xdebug, wiring up the ports — is handled by Grove, our local dev environment. Which brings us to the fun part.
The 90-second tour
1. Turn Xdebug on. Open Settings (⌘,), go to Laravel, and flip Enable Xdebug. Behind the scenes that runs:
grove debug on
Grove loads Xdebug into its PHP pools in trigger mode — meaning it stays completely dormant, with basically zero overhead, until a request actually asks to be debugged. No permanent tax on your dev server.
Prefer the terminal? The toggle just mirrors that command, and on startup e reads grove debug status so the switch always tells the truth.
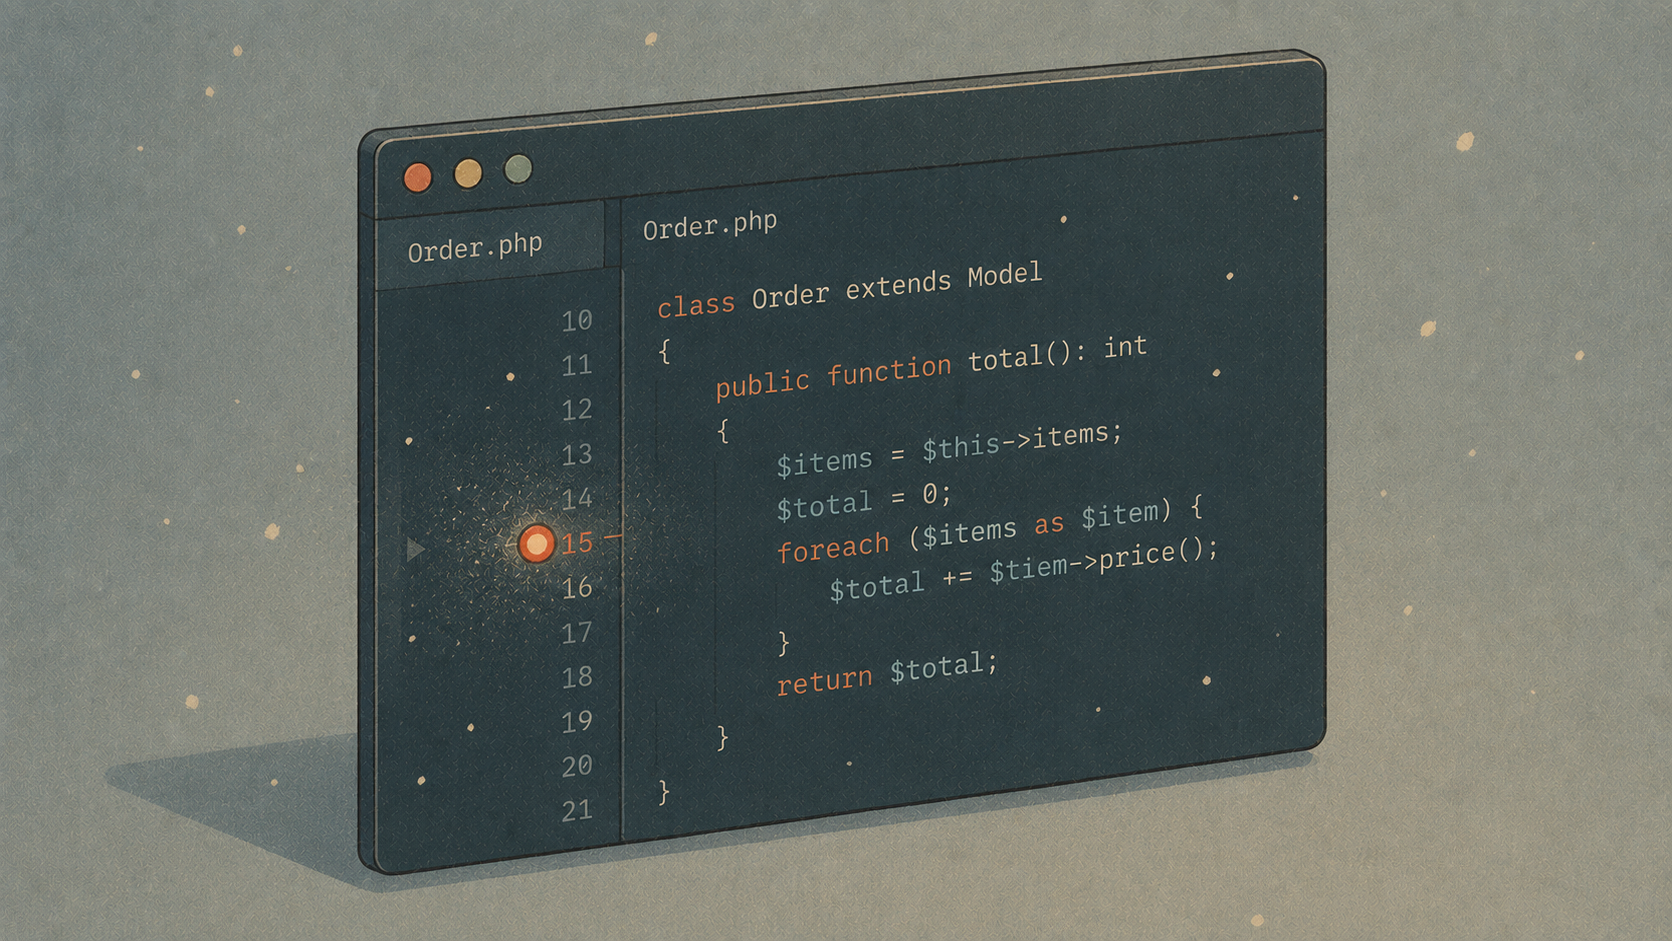
2. Set a breakpoint. Click a line and press F9 — or just ⌥-click it. A red dot appears in the margin:
public function store(Request $request)
{
    $data = $request->validated();
●   $order = Order::create($data);   // ← breakpoint here
    OrderShipped::dispatch($order);
    return redirect()->route('orders.show', $order);
}
3. Press F5. The Debug panel opens, the adapter spins up over Grove's bundled Node (no nvm, no global installs), and Xdebug quietly starts listening on port 9003.
4. Trigger the request. Hit the route from your browser with an Xdebug helper extension, or just add ?XDEBUG_TRIGGER=1. Doing it from the CLI instead — an artisan command, a test? One line:
eval "$(grove debug env)"
php artisan orders:process
The moment execution reaches your breakpoint, e jumps to the line, highlights it, and fills the panel with the call stack and every variable in scope. Now you can actually look:
Call Stack
  OrderController->store   OrderController.php:14
  {closure}                RouteCollection.php:211
  {main}                   index.php:55
Variables
$data     array(3)
$order    App\Models\Order
$request  Illuminate\Http\Request
Step through with F10 (over), F11 (into), ⇧F11 (out), or F5 to let it run. Click any frame in the stack to jump straight to that line in your code.
The part we're quietly proud of
Two small things that took real care:
It never gets in your way. Debugging is entirely opt-in. The editor doesn't touch Grove, Xdebug, or any adapter unless you press F5. And when it does, the adapter is launched completely off the UI thread — so even if an adapter is missing, or slow to come up, or you don't have Grove installed at all, the editor never so much as stutters. Worst case, you get a friendly line in the Debug panel telling you what to install. You can even set breakpoints with nothing installed; they'll just be waiting when you're ready.
It's not only for PHP. Because e-dap speaks plain DAP over both stdio and TCP, the same panel drives:
PHP via Xdebug (with Grove)
JavaScript / TypeScript via vscode-js-debug
Rust / C / C++ via codelldb
e picks the right adapter from the file you're in and finds it automatically from your installed VS Code or Cursor extensions. Open a .ts file, press F5, and it Just Works — same breakpoints, same call stack, same muscle memory.
The keys, all in one place
Key Action F5 Start / continue F9 or ⌥-click Toggle breakpoint F10 Step over F11 Step into ⇧F11 Step out
Everything's in the command palette too (⌘⇧P → "Debug: …"), and there's a full write-up in the docs under Debugging.
Update and try it
If you're already running e, the built-in updater will offer 0.6.7 next time you launch. Otherwise, grab it from the releases page.
Keep your dd()s — they're still great for a quick peek. But the next time you hit one of those bugs, the ones that laugh at breadcrumbs, just click the margin and press F5. Stop time. Look around. It's a good feeling, and now it lives right where you already work.
Happy debugging. 🐛→🦋