Grove 0.7 — a request timeline that was hiding in plain sight
Grove 0.7 adds a live timeline of every HTTP request your local sites handle — CLI and desktop, for any framework, with zero packages and zero setup. It was latent in the proxy all along.
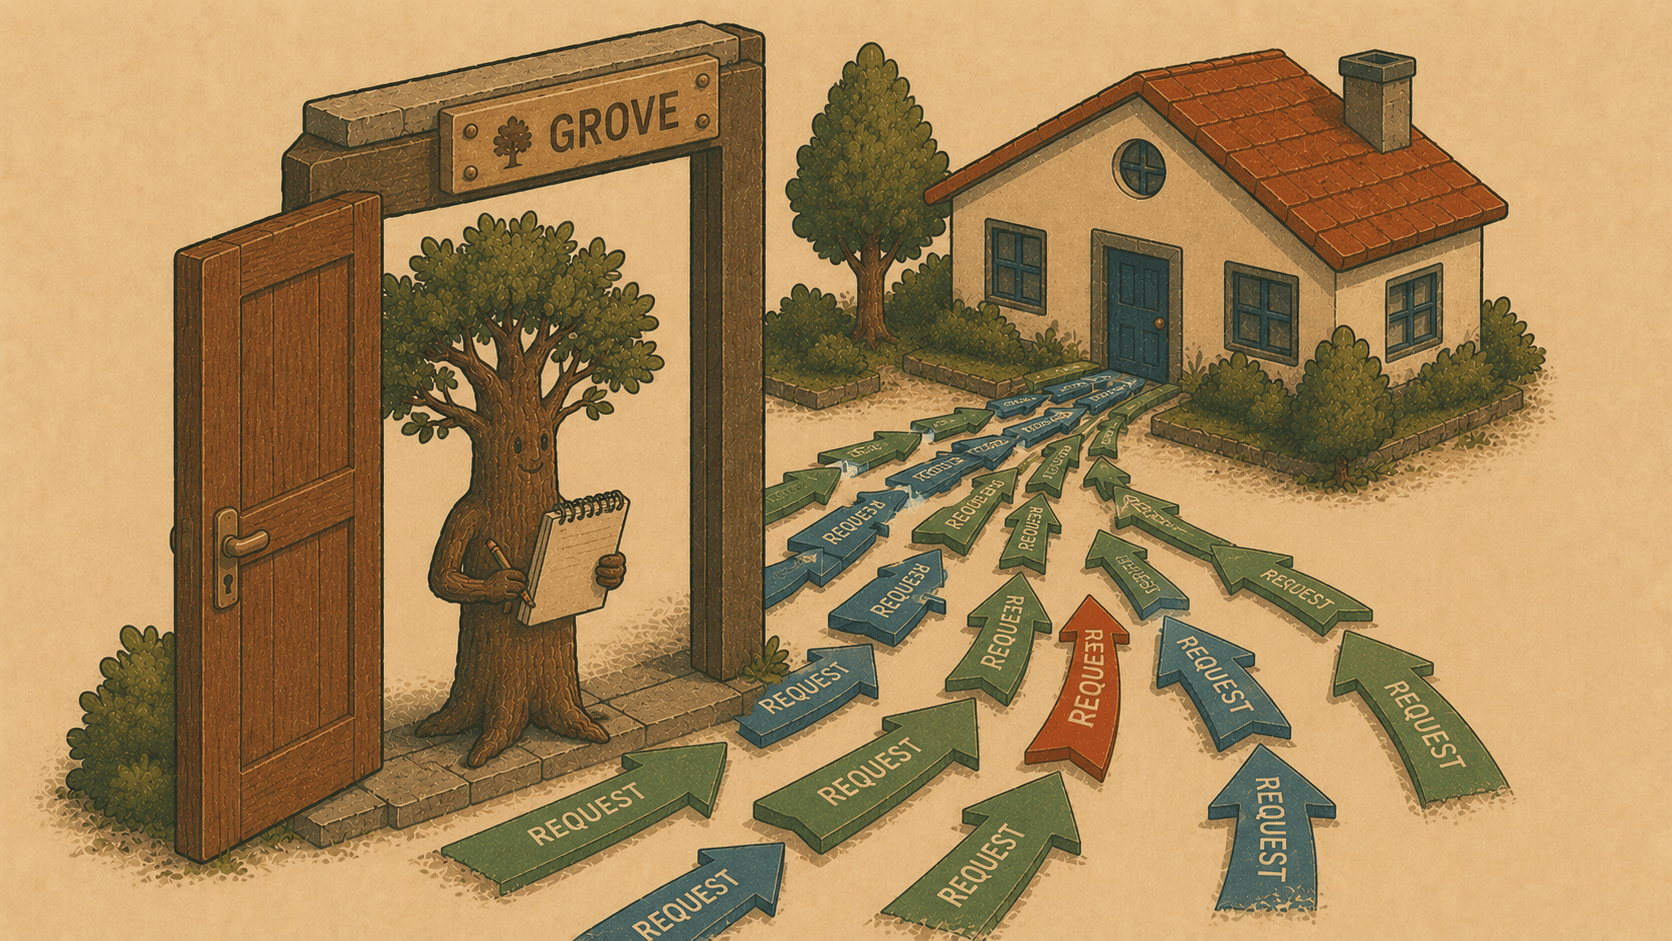
Every so often you build a feature and realize it was already there — latent in the architecture, just waiting for someone to expose it. Grove 0.7 is one of those. It adds a live timeline of every HTTP request your sites handle, and it needed almost no new plumbing to do it. Here's why, and how.
Why: Grove is already standing in the doorway
When you open https://myapp.test, the request doesn't go straight to your app. It goes to Grove first. Grove is the reverse proxy — it terminates TLS, matches the host to a site, and hands the request off to PHP-FPM, or a static file, or an upstream Vite/Docker process.
Which means Grove sees everything. Every method, every path, every status code, every millisecond — for every site, in every framework, whether it's Laravel, WordPress, a Node app behind a proxy, or a plain folder of HTML.
Tools like Laravel Telescope are wonderful, but they live inside one framework. You install a package, run a migration, and it watches that one app. Grove sits one layer lower, at the doorway all traffic passes through. So it can offer the same "what just happened?" answer for anything — with zero packages, zero migrations, and zero per-app setup.
That's the pitch: a zero-config request inspector for any local site.
How: a ring buffer and one line in the proxy
The whole feature is delightfully small. In the proxy handler — the function that already routes every request — Grove now notes four things when a request finishes: the method and path, the status it returned, and how long it took. That gets pushed into a bounded ring buffer that keeps the last 500 requests in memory.
Bounded and in-memory matters: it costs nothing at rest, never grows without limit, and nothing touches the disk. When you restart the daemon, the log starts fresh. It's a scratchpad, not a database.
Because the buffer is shared between the proxy and the daemon, both the CLI and the desktop app can read it live.
On the command line
$ grove requests
12:04:31.512  200  GET      8ms  blog     /
12:04:31.601  200  GET      3ms  blog     /build/assets/app.css
12:04:33.020  404  GET      1ms  blog     /favicon.ico
12:04:35.418  302  POST    24ms  blog     /login
12:04:35.482  200  GET     11ms  blog     /dashboard
Filter to one site, or widen the window:
$ grove requests blog --limit 100
And --json for scripting or piping into your own tools:
$ grove requests --json | jq '.data.requests[] | select(.status >= 500)'
There's a quiet detail worth noticing: that 404 /favicon.ico and any 502s show up too. Grove records the responses it generates — a missing host, a stopped Docker container, a FastCGI hiccup — not just what your app returns. So when something breaks before it ever reaches your code, the timeline still tells you.
In the desktop app
The new Requests panel makes it live. It refreshes every second and reads like a heartbeat monitor for your local dev:
Status colours — 2xx green, 3xx blue, 4xx amber, 5xx (and hard errors) red. You spot a wall of red instantly.
Slow requests highlighted — anything at or above 500ms is called out, so an N+1 or a sleepy endpoint jumps off the screen.
A per-site filter — narrow to the app you're working on.
A little stat line — how many requests are shown, the average latency, and the current error rate.
Click Pause when you want to study a moment without it scrolling away; Live to resume.
It's the thing you reach for when you reload a page and something's off — a redirect loop, an asset 404ing, a call that's mysteriously slow — and you want to see it happen in real time without opening dev tools, tailing a log, or installing anything.
The pattern behind it
Grove 0.7 didn't add a subsystem. It surfaced one. The request timeline is a handful of lines in a place requests already flowed through, plus a small panel to make it visible. That's the whole shape of the thing.
It's also a preview of where Grove is heading: because it's the proxy and it owns your services, it's uniquely placed to answer questions no single-tool CLI can — and to do it for every site at once, for free.
$ grove requests
Grove auto-updates — after it relaunches, hit Tools → Restart daemon, open a site, reload, and watch the requests roll in. 🌱🌳
Next on the workbench: grove.toml + grove up — commit your project's PHP/Node/service requirements, and let a teammate go from git clone to a running, identical environment in one command.