Debugging without the ceremony — Grove 0.2.9
Grove 0.2.9 turns Xdebug step-debugging into a single toggle — trigger mode, no php.ini edits, editor listening on port 9003. Plus an honest account of why fully-static PHP can't be debugged, and what to do about it.
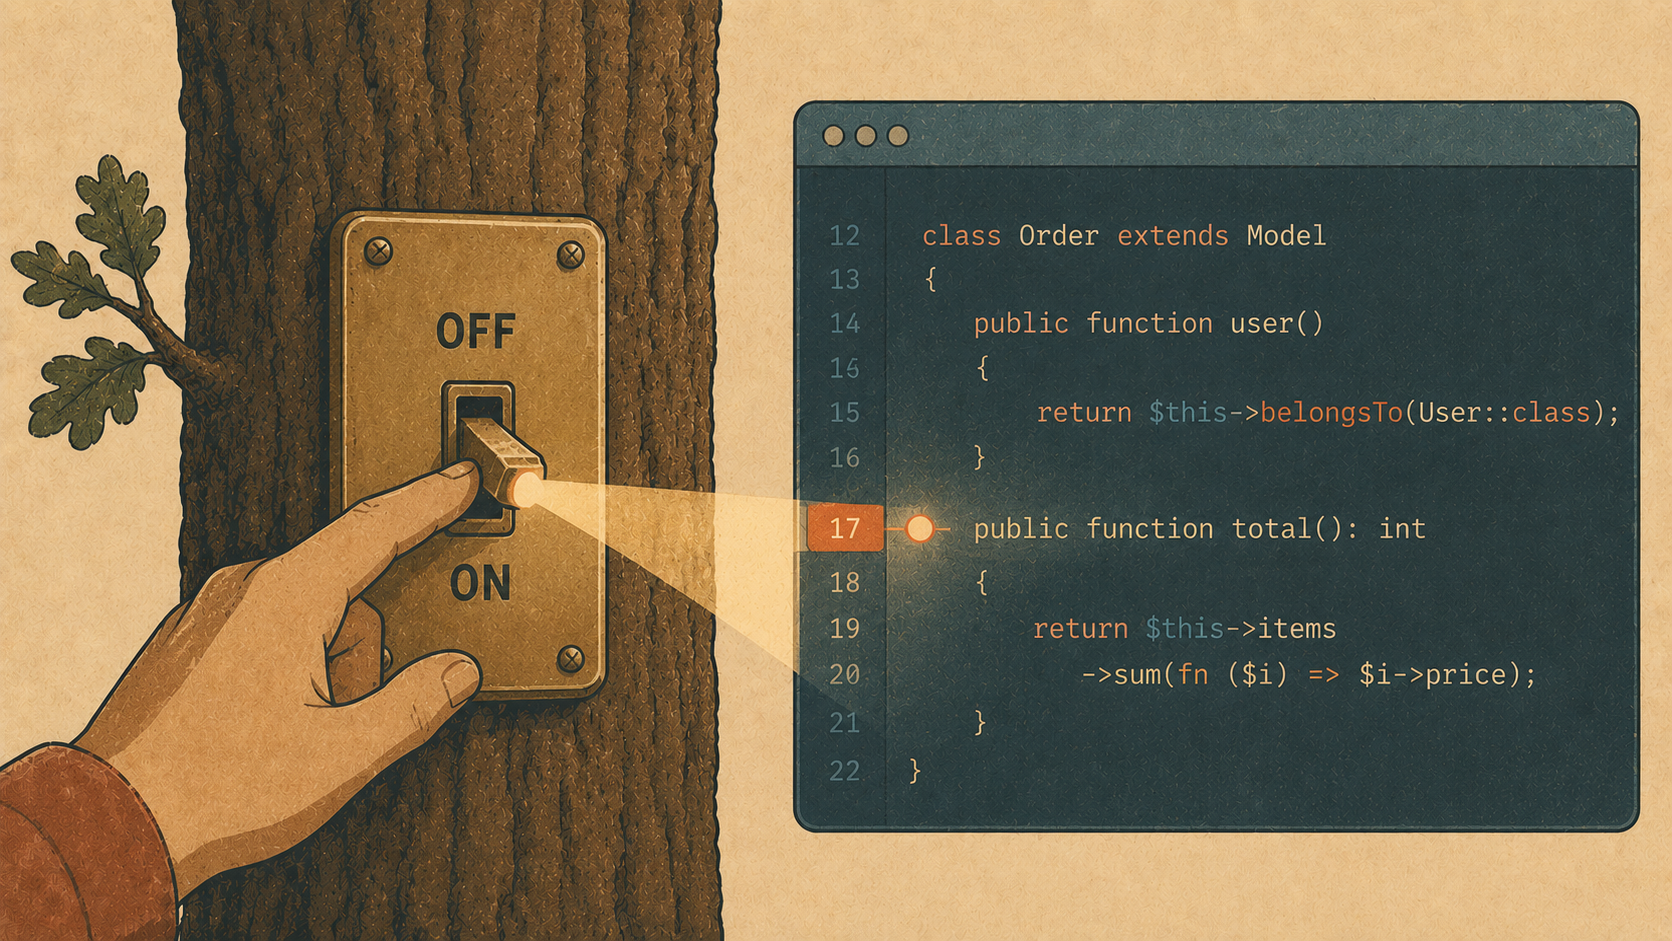
There's a moment in every developer's day that deserves better than it usually gets: the moment you stop guessing what your code is doing and actually watch it. Set a breakpoint, reload the page, and step through line by line while the variables reveal themselves. It's one of the most powerful things you can do — and yet setting it up has a reputation for being fiddly enough that a lot of us just… sprinkle dd() everywhere and move on.
Grove 0.2.9 is about making that first move — turning step-debugging on — feel like flipping a light switch. It also comes with an honest story about a limitation we ran straight into, which I think is worth telling.
Why: dd() is fine, until it isn't
dd() and ray() are great. But some bugs live in the space between lines — a loop that runs one too many times, a value that's null when you swore it couldn't be, a middleware that quietly rewrites a request. For those, nothing beats a real debugger: pause execution, inspect the whole call stack, hover over variables, step in and out.
The tool for that in PHP is Xdebug, and the friction has always been the setup: editing php.ini, restarting things, remembering the magic port, worrying about the performance hit of leaving it on. Grove's job is to make that setup disappear.
How: one toggle, trigger mode, done
Open Tools → Xdebug step-debugging and flip the switch:
  🛠  Tools
  ┌───────────────────────────────────────────────────────────────┐
  │  Xdebug step-debugging                                 (──● )  │  ← live toggle
  │  Load Xdebug into PHP-FPM on demand. A request opts in with    │
  │  the XDEBUG_TRIGGER cookie/param; editor listens on port 9003. │
  │                                                                 │
  │   php@8.4    ready (built into this PHP)                        │
  │   php@8.3    unavailable — needs a PHP with Xdebug              │
  │                                                                 │
  │  Needs a PHP that has Xdebug — grove php register.              │
  └───────────────────────────────────────────────────────────────┘
Prefer the terminal? Same thing:
  $ grove debug status
  Xdebug disabled (DBGp port 9003)
    php@8.4  ready (built into this PHP)
    php@8.3  unavailable — needs a PHP with Xdebug (grove php register)
$ grove debug on
Xdebug enabled (FPM pools reloaded, DBGp port 9003).
Start a session with the XDEBUG_TRIGGER cookie/param, or grove debug env for CLI.
Two details make this pleasant to live with:
It never touches your php.ini. Grove loads Xdebug per FPM pool via -d startup flags, so nothing global changes and toggling it off leaves no trace.
It stays out of the way until you ask. Xdebug runs in start_with_request=trigger mode — the extension is resident but dormant. A normal request pays almost nothing; a request only starts a debug session when it carries the XDEBUG_TRIGGER cookie or query param. Install the "Xdebug helper" browser extension, click the little bug, reload — and now you're debugging. Everyone else hitting the site notices nothing.
Debugging the browser side
In your editor, start a "Listen for Xdebug" / DBGp session on port 9003.
Toggle Xdebug on in Grove.
Flip the browser extension to Debug and reload your
*.testpage.Your breakpoint hits. 🎯
Debugging the CLI side (artisan, tests)
The browser trigger doesn't help a command-line process, so Grove prints the exact environment for it:
  $ eval "$(grove debug env)"
$ php artisan queue:work        # now connects to your editor's listener
Under the hood that's just:
  $ grove debug env
export XDEBUG_MODE=debug
export XDEBUG_SESSION=1
export XDEBUG_CONFIG="client_host=127.0.0.1 client_port=9003"
Grove speaks the runtime half of this — getting Xdebug loaded and pointed at the right port. Your editor's DAP/DBGp client is the other half, and it listens; Xdebug connects out to it.
The honest part: static PHP can't be debugged
Here's the limitation I promised. Grove's bundled PHP builds are fully static — a single self-contained binary with no external dependencies, which is exactly what makes "download Grove and go" work without Homebrew or a system PHP.
But that superpower has a cost: a fully-static PHP cannot load Xdebug. Xdebug is a Zend extension, and static PHP has no way to dlopen an external .so — and the tool we build our PHP with (static-php-cli) flatly refuses to compile Xdebug in, either:
Extension [xdebug] does not support static build!
We explored shipping a parallel "debug build," a CI pipeline, a downloadable xdebug.so — and every path dead-ended on the same wall. So rather than ship a button that could never work, 0.2.9 does the honest thing: it tells you the truth.
If you want to step-debug, register a PHP that already has Xdebug:
  $ grove php register /opt/homebrew/opt/php/bin/php
✓ registered php@8.4 (with xdebug)
$ grove debug status
Xdebug disabled (DBGp port 9003)
php@8.4  ready (built into this PHP)
Isolate a site to that build (grove isolate myapp 8.4), toggle Xdebug on, and you're debugging — with Grove handling all the wiring.
Getting it
Grove auto-updates. After it relaunches, restart the background service to pick up the new daemon — one click now:
Tools → Restart daemon ↻ (no password)
Then:
  $ grove status | head -1
Grove 0.2.9
Not every feature is about adding power — some are about removing the little rituals that stand between you and the work. Turning on a debugger shouldn't require a config-file pilgrimage. Flip a switch, click the bug, watch your code run.
And when a tidy story meets a stubborn technical wall, the kindest thing software can do is be honest about it. 🌳