Interface
The window
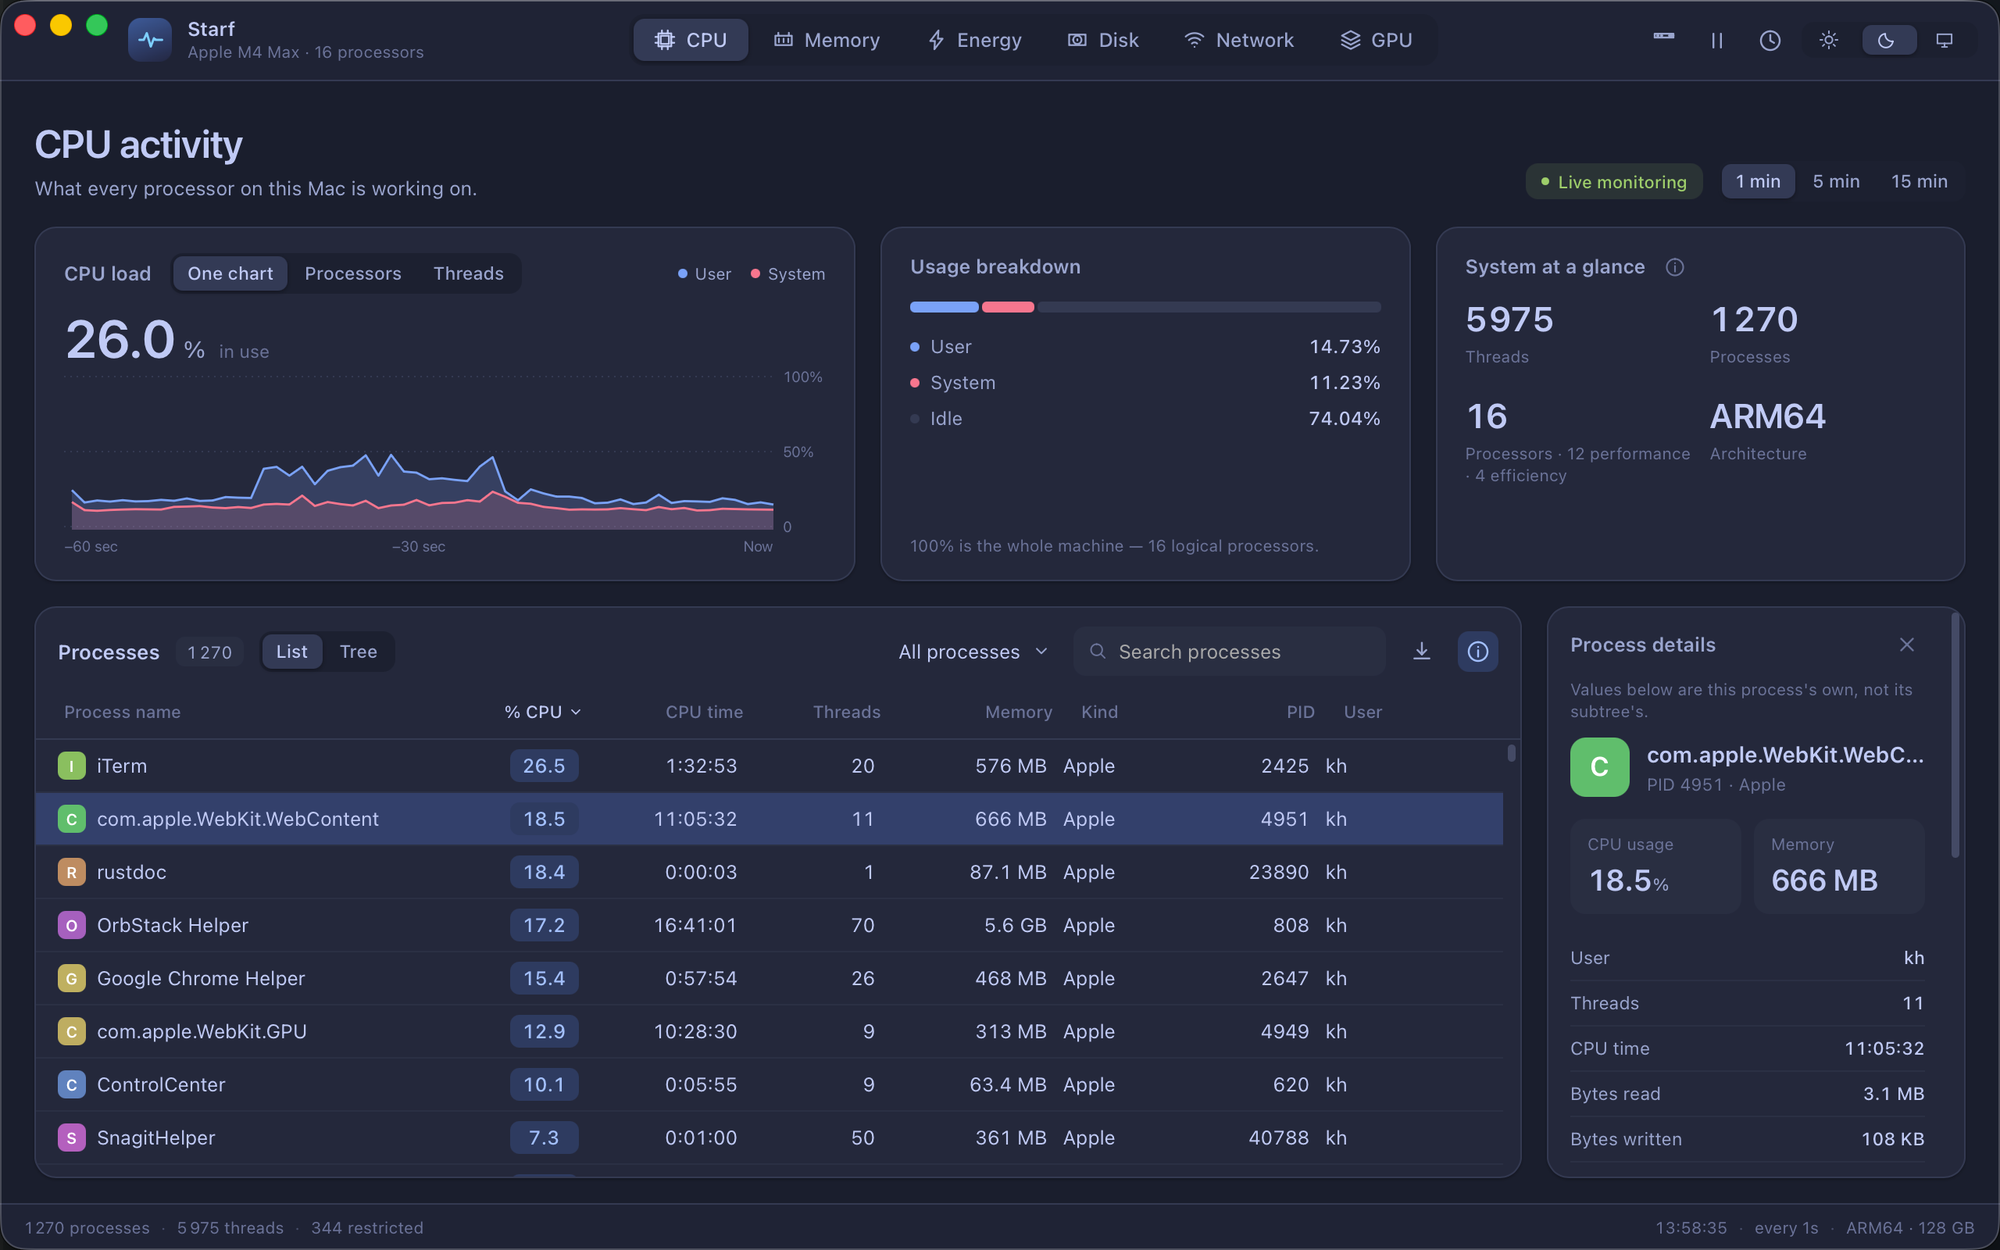
A title bar with the metric tabs, an overview of three cards, and the process table with an optional inspector. The status bar counts processes, threads and the ones macOS restricted.
| Control | Where |
|---|---|
| Metric tabs | centre of the title bar |
| Menu bar monitor, pause, refresh interval, theme | right of the title bar |
| Range — 1, 5 or 15 minutes | beside the heading |
| List or Tree, filter, search, export, inspector | process table header |
| Key | Does |
|---|---|
⌘F |
focus the search field |
⌘⇧T |
switch between List and Tree |
Space |
pause and resume |
Escape |
clear the search, then the selection; close the diagnostics window |
↑ ↓ |
move the selection |
← → |
collapse and expand branches in Tree mode; hold ⌥ for the whole branch |
Tabs
CPU
The card shows the machine's load as a share of total capacity, so user + system + idle is always 100. The breakdown gives those three. Three chart modes:
- One chart — the whole machine over the selected range.
- Processors — a grid of one chart per logical processor, each on its own 0–100% axis. Filter by Performance or Efficiency and the remaining tiles spread into the space. Click a tile for its full history with a hover readout. When there are more tiles than fit, the grid scrolls; Pages is offered as an alternative, and shows exactly the number that fits so a tile is never half cut off.
- Threads — the same grid for a selected process's threads. It collects only while this mode is open with a process selected.
Blue is total utilisation; pink is the system portion of it, not a second quantity to add on.
Memory
Used is active + wired + compressed. Cached is inactive + speculative — reclaimable, and shown separately. The breakdown bar is the one place the parts really do sum to the whole. The glance card carries physical memory, pressure, swap and cached files.
Energy
Battery charge over time, with the controller's own figures: cycle count, charge against design capacity, voltage, current, temperature, and the adapter's rating. The process list opens on Applications.
Apple's per-process Energy Impact is a private metric Starf cannot read. It is not implemented and nothing stands in for it; the table says so. What is shown there is the same CPU counters the CPU tab shows.
Disk and Network
Disk figures are process-lifetime counters, not whole-device totals; throughput excludes processes that exit between samples and ones whose counters cannot be read. Network totals aggregate non-loopback interfaces since each was created, so VPN and bridge traffic may be counted at more than one.
The Network process list shows per-process bytes and packets from nettop. They are
cumulative totals, not rates, and follow the connections nettop can see — so they need
not add up to the interface totals above.
GPU
Device utilisation over time, with renderer and tiler as independent meters rather
than a stacked bar — they overlap and must never be summed. The process list gains % GPU
and observed GPU time.
History is kept per device, so a machine with more than one gets a selector and a device that disconnects keeps its history with a gap where it stopped reporting, rather than having another device's readings continue its line.
The process table
Search matches name, user or PID. Filters — All, Mine, Active, Applications — match individual processes in both modes.
Sorting a column sorts by the value that column displays. Unavailable values sort last whichever direction you choose.
Columns
Drag a column's right edge to resize it, or double-click that edge to fit it to what it actually holds — measured in the table's own font, not guessed. Drag a header to reorder. The button at the right of the header row chooses which columns are shown, and restores the defaults.
Each table remembers its own layout, and each metric's process table remembers its own, because they show different things. Only what you actually changed is stored, so a column you never touched still follows its definition.
Hiding a column hides it from view only. Search still matches it and exports still carry it — a column you hid is not one you stopped caring about.
Tree mode
Children appear under their parent, with disclosure arrows. Everything is expanded until
you collapse it; Expand all and Collapse all sit in the header.
Numeric columns switch to Σ — the process plus every current descendant, counted once,
including descendants hidden by search or collapse. Expanding, collapsing or searching
never changes a total. ≥ marks a lower bound, — means nothing was reported, and a
badge on each parent gives its subtree's process count. Hovering a Σ cell shows the
process's own value and how many members reported.
Parent and child totals overlap by construction. The banner above the table says so, because adding the visible rows is the natural mistake.
Searching shows matches with their whole ancestor path; ancestors that did not match are muted and marked Parent. The search keeps its own collapse state, so a new search reveals its matches, you can still collapse branches inside it, and clearing the search restores what you had.
Expansion is keyed by PID and start time, so a recycled PID does not arrive collapsed.
Inspector and actions
The inspector shows the selected process's own values, never its subtree's, and says so. It carries Show in Finder, Quit and Force quit — both confirmed, both refused for processes another account owns, and both re-checking the process identity first — and opens the diagnostics window.
Export
Exports the rows you can see, in the order they are drawn, as CSV or JSON. Unavailable
counters stay unavailable: an empty CSV cell, a JSON null. Tree exports add each
additive column's subtree total with its reporting count and whether it is complete,
partial, overflow or unavailable, kept in a separate object from the process's own
values.
Menu bar monitor
Off until you turn it on. It shows one live figure — the same number the matching card shows, formatted the same way — and reads from the sampling turn the collector already took rather than starting one of its own.
Left click opens a popover with the metric switch, the figure, a one-minute chart and pause. Right click gives a menu to choose the metric, show the window, or quit.
Pins
Keep in menu bar in the inspector puts a process in the menu bar with its own figure. Its menu chooses which metric, opens the window on that process, or removes it.
A pin is identified by PID and start time. When the process exits, the pin keeps its last figure and says so; it never starts reporting whatever later takes that PID. Pins last only as long as this run of the app — a PID from a previous run means nothing, so restoring them would be guessing.
The popover is one window reused by whichever item opened it, anchored under that item, and it closes when it loses focus.
Themes
Light, dark or system. Dark is Tokyo Night Storm.